 EcorisMap
CHAPTER 04
Create Survey Forms
In EcorisMap, a layer is your survey form. You design the items (fields) to record and decide how they look on the map. Manage layers on the Layer list screen, opened with the “layers” button, which also leads to their data, styles, and settings.
Layer list
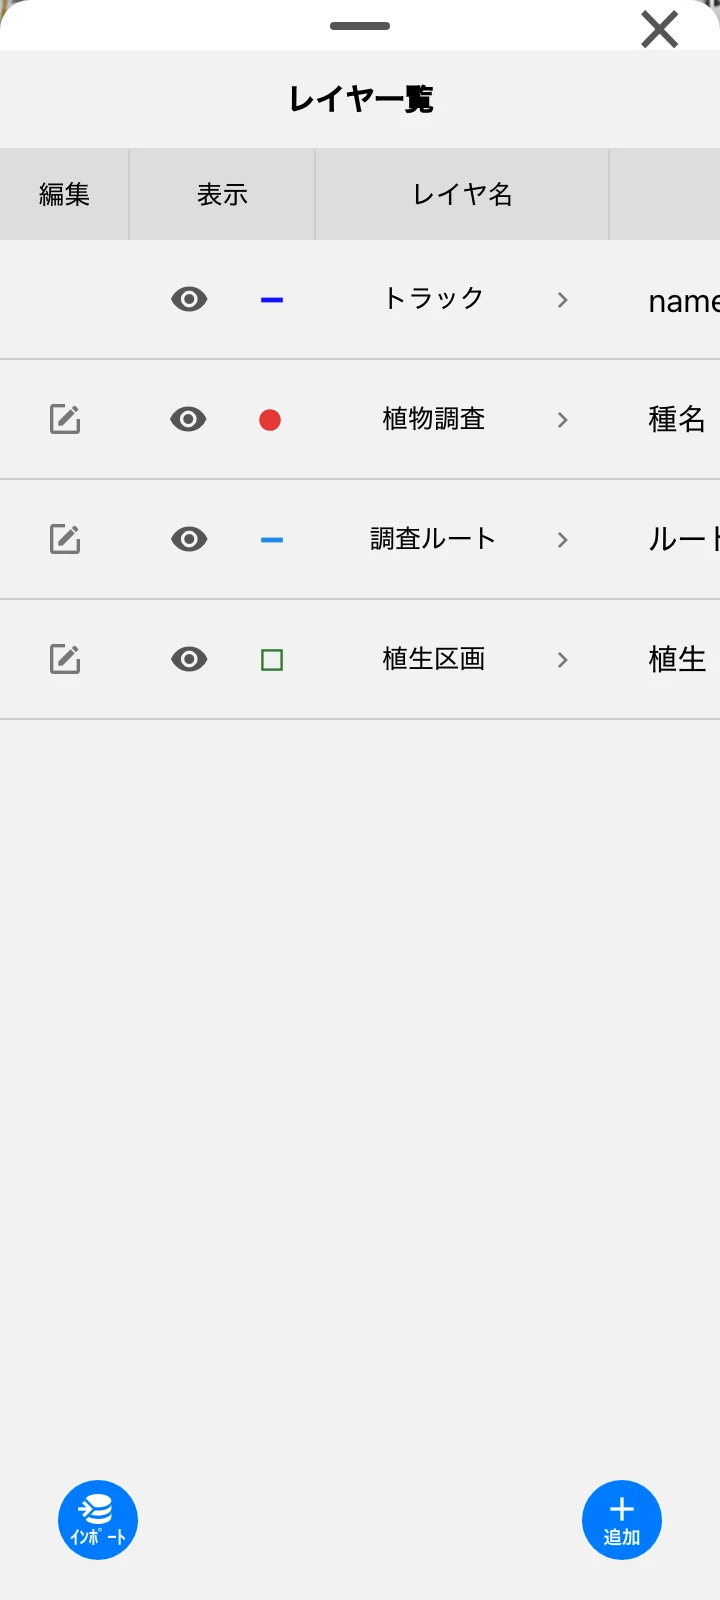
The table can be scrolled horizontally. Its columns and the buttons at the bottom of the screen are as follows.
- Edit — Toggles with a check which layer is put into edit mode. Adding and editing features apply to the layer in edit mode. Layers of the same type (such as Point) cannot be in edit mode at the same time. Checking one automatically unchecks other layers of the same type. The “No coordinates” type is exempt from this rule. You can also switch the layer in edit mode from the editing-layer label at the top of the map screen. If you select a drawing tool with no layer in edit mode, the app guides you to choose the recording destination (see Draw Points, Lines & Polygons).
- Visibility — Use the eye icon to show or hide the layer. Toggling a group parent also affects its child layers. Tapping the color mark next to it (points, lines, and polygons only) opens the Style settings screen (see Changing the style).
- Layer name — Tap to open that layer’s Data list screen. Long-press to reorder by dragging.
- Label — Selects the field to display as a label on the map. See Showing labels.
- Settings (gear) — Opens the Layer settings screen.
- Up/Down — Moves the layer’s display order one step at a time. Moving a layer just below a group moves it into or out of the group. Dragging does the same thing. Moving a group parent moves its child layers together.
- import — Loads a data file. See Import Data.
- group — Creates a group (folder) to organize layers. Press the button and enter a group name; the new group is added to the top of the list.
- add — Creates a new survey form. The Layer settings screen opens, where you design the items to record.
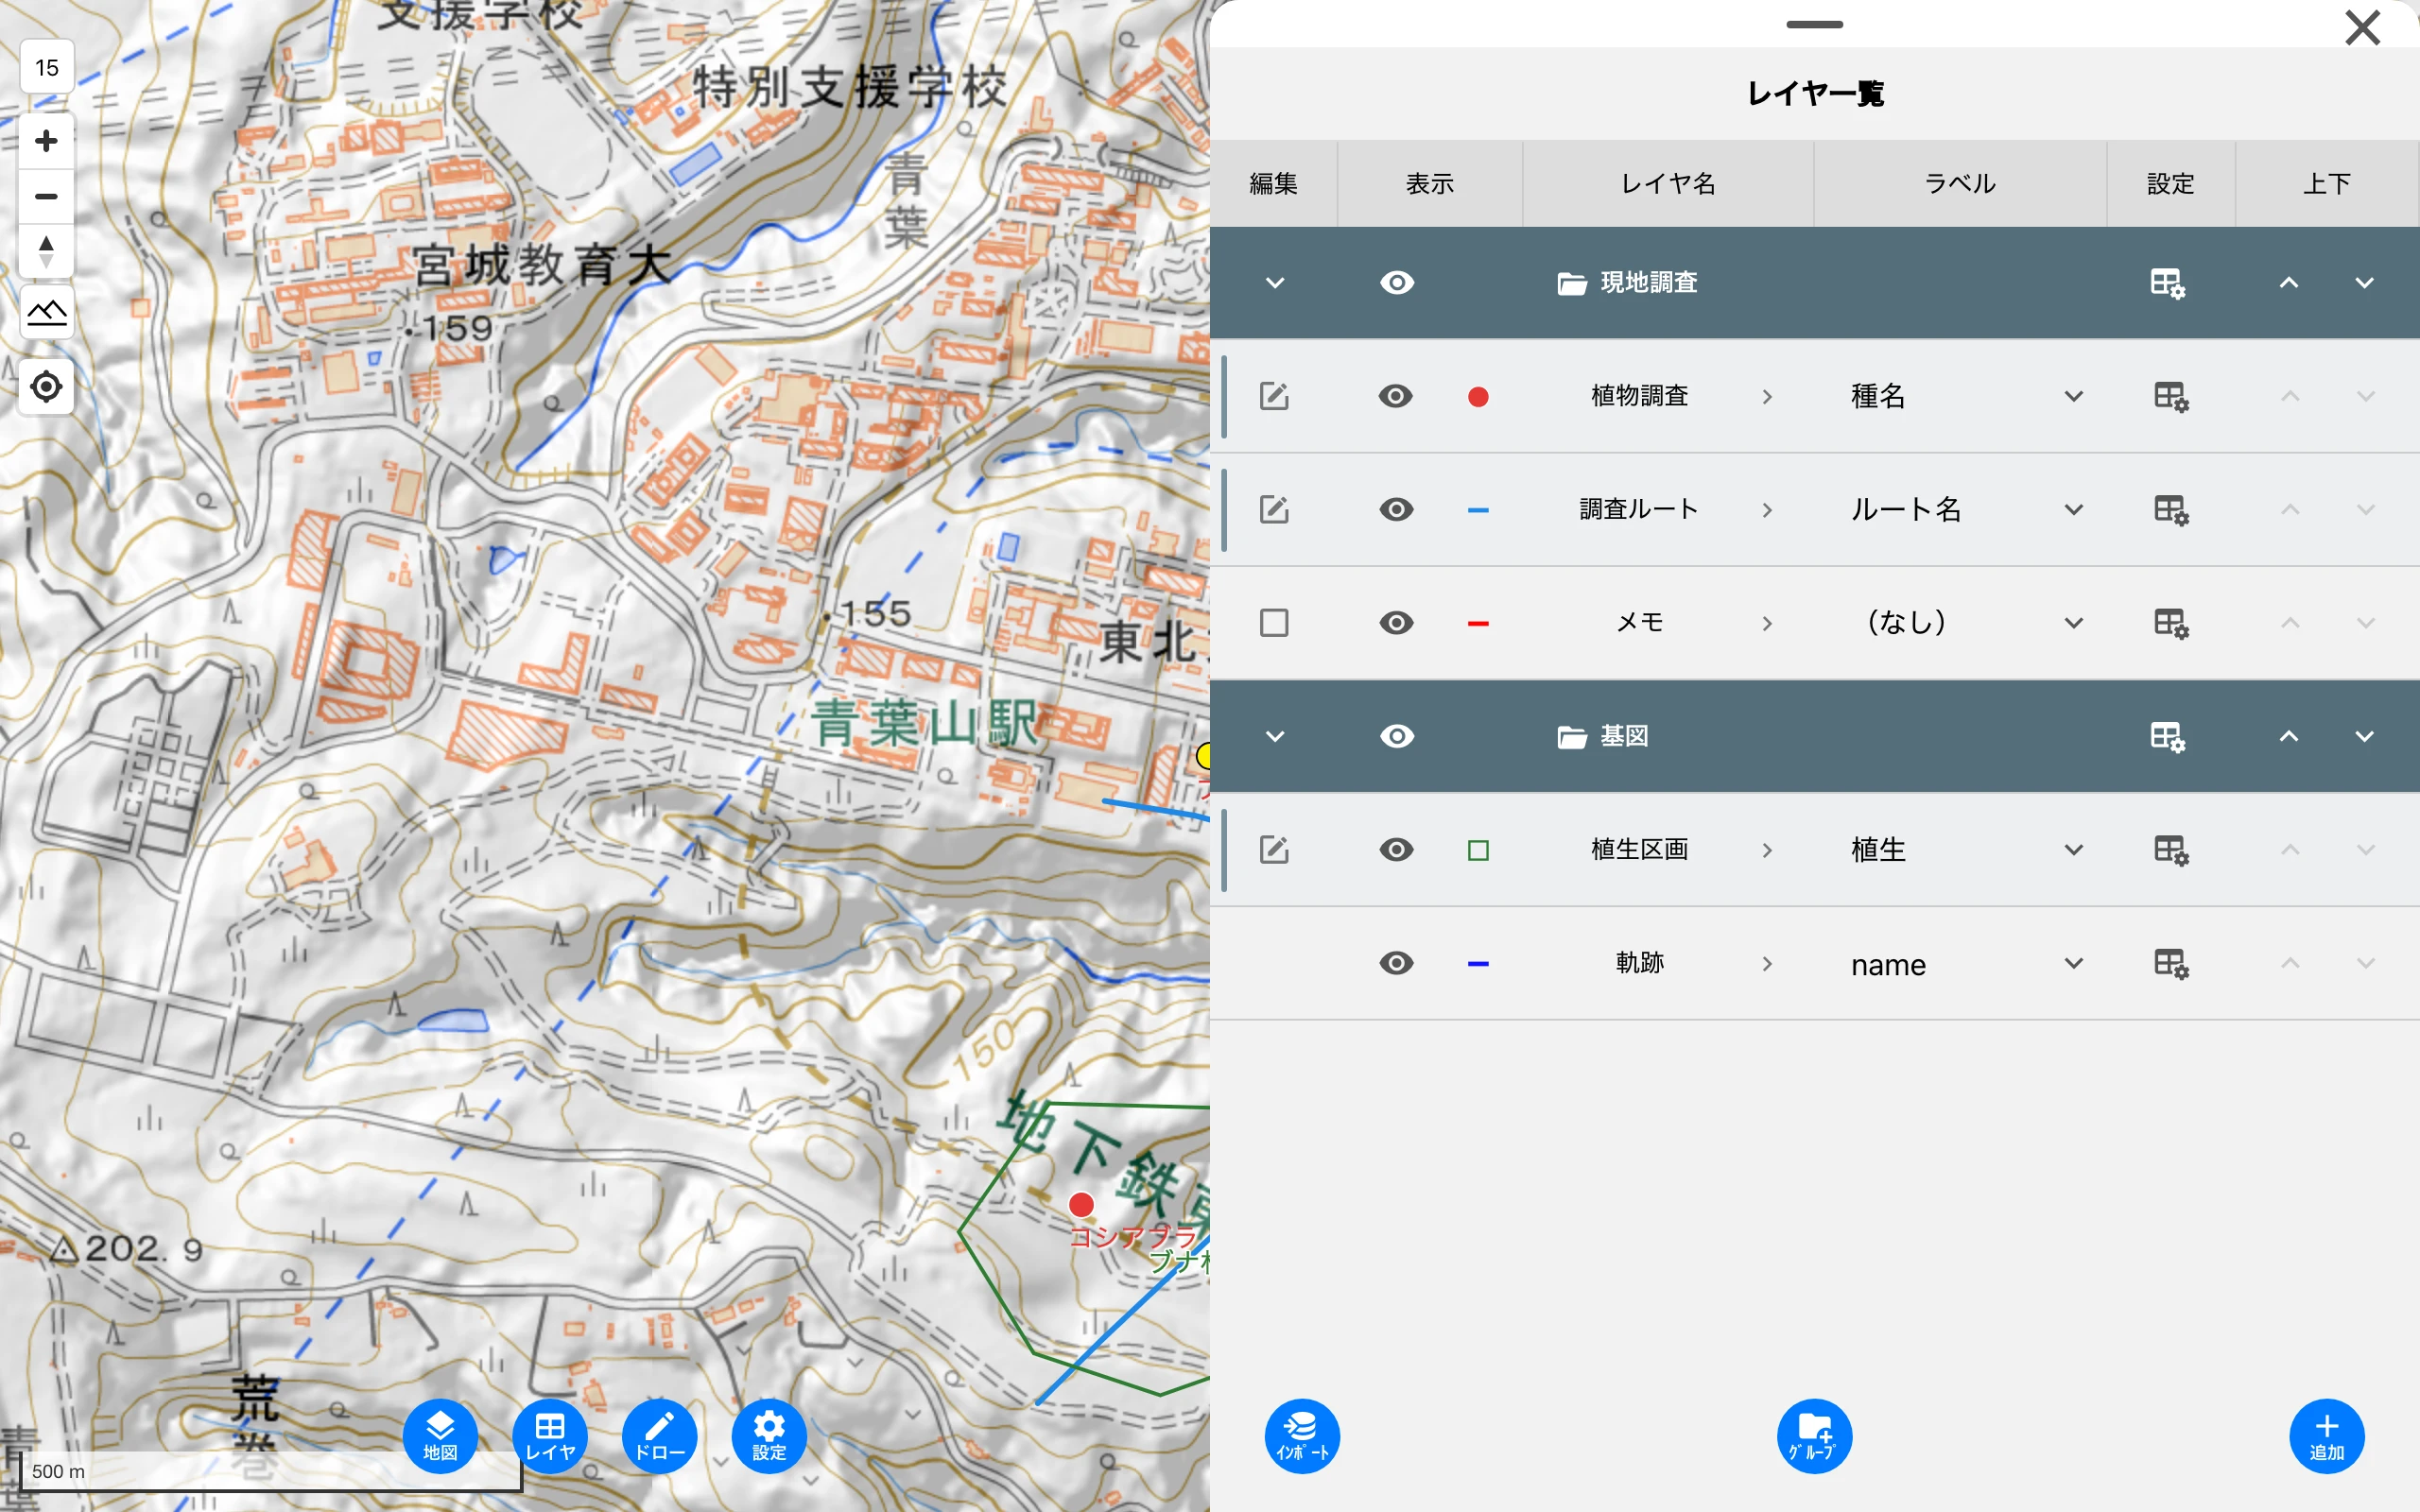
Special layers
- Track layer — A built-in layer that is the destination for track recording. The edit check and settings button are not shown.
- Memo layer — A built-in layer that is the destination for map memos. Its name and fields cannot be changed or deleted (only the sharing scope can be changed).
- Layer group — A folder for organizing layers. Create it with the “group” button at the bottom of the screen. Expand and collapse it with the folder icon.
Layer settings
This is where you build your survey form. Set the layer name and type, then line up the items (fields) to record. Create a layer with “add” on the Layer list, or edit an existing one with the gear button.
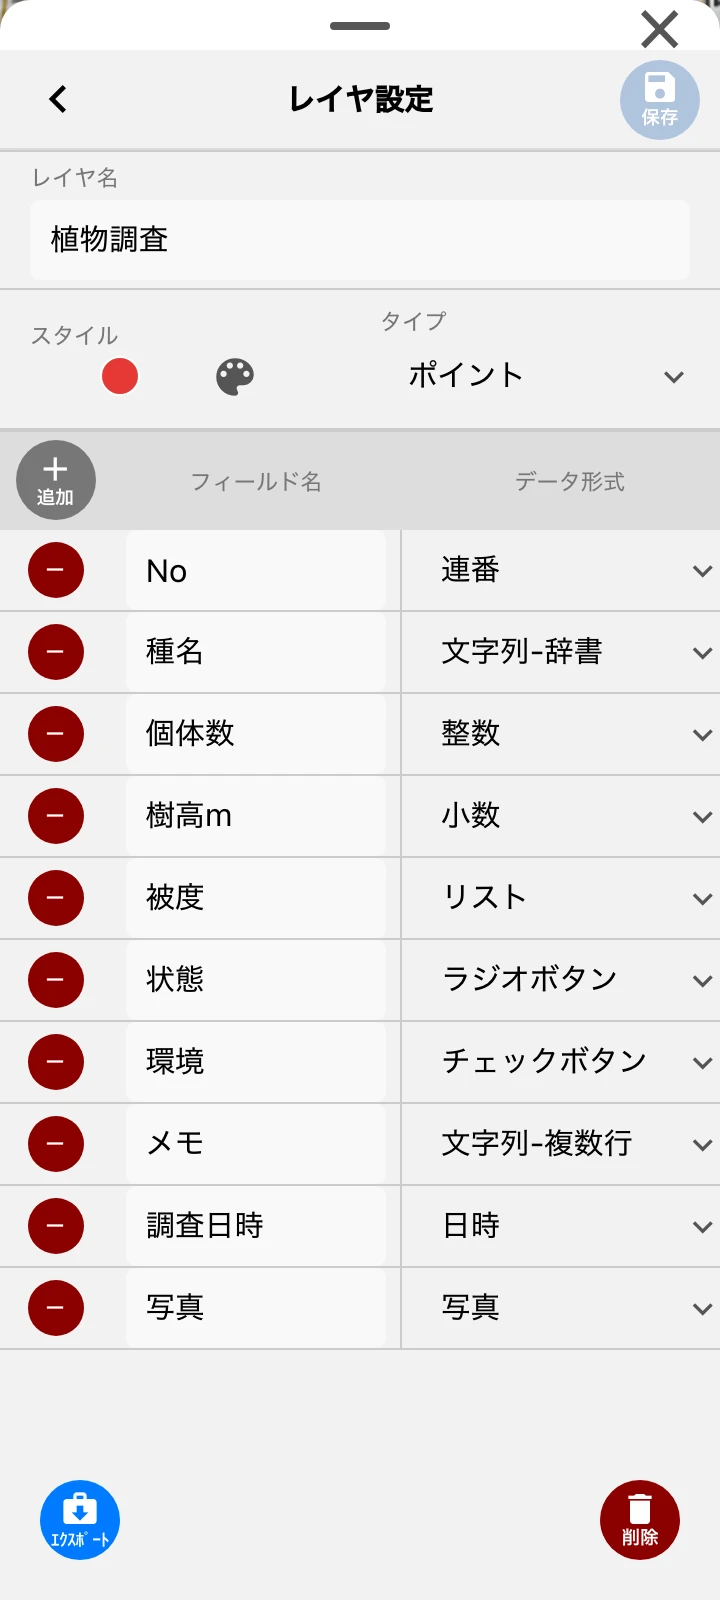
- Layer name — Enter the name of the layer. Characters that cannot be used in file names are removed automatically.
- Style — Tapping the color mark opens the Style settings screen. See Changing the style for what you can configure.
- Type — Choose from Point / Line / Polygon / No coordinates. The type can only be changed when creating a new layer.
- Purpose — For polygons you can choose “Vegetation map”, and for lines “Flight map” (organization accounts only). Setting a purpose shows a dedicated tool palette when drawing (see Draw Points, Lines & Polygons). Choosing “Vegetation map” creates the vegetation-category (“植生区分”) and category-code (“区分コード”) fields and sets the color type to the vegetation category.
- save (top right) — Saves your changes. Adding, deleting, or changing the format of a field is also reflected in existing data.
- export — Writes out only the layer settings to a file. The file excludes data and includes the dictionary. Use it to reuse a layer structure or move it to another device.
- delete — Deletes the layer. The app asks “Do you want to delete the layer? The data in the layer is also deleted.” Deleting a group leaves the layers inside it.
Field settings
Add the items (fields) to record, then set their names and data formats.
- add — Adds a field (a recording item).
- Field name — Enter the item name. Duplicate names and “_id” are not allowed.
- Data format — Choose the format of the values to record. See the table below.
- Set value (>) — Opens a screen to set candidate values and default values. It is available only for applicable formats. See “Setting values” for what you can configure.
- Up/Down and delete — The up/down buttons move a field one step at a time, and the delete button removes it.
Field data formats (all 19)
| Category | Data format | Description |
|---|---|---|
| Text | String | Single-line text |
| String-multipleLines | Multi-line text | |
| string-dictionary | Narrow-down input from registered candidates. Supports voice input. See Dictionary input | |
| String-dynamic dictionary | A dictionary where entered values are automatically added to the candidates | |
| Number | Integer / Decimal | Numeric input with +/- buttons |
| NumberRange | Records a range with two numbers | |
| Serial | Automatically assigns serial numbers | |
| Date/Time | DateTime / Date / Time | Input via picker |
| TimeRange | Records a start-to-end time | |
| Choice | List | Choose one from candidates. “Other” also allows free input |
| Radio | Choose one from candidates | |
| Check | Choose multiple from candidates | |
| Other | Photo | Take and attach photos |
| Reference | Associates and displays data from another layer | |
| Table / ListTable | Records multiple values in a table format |
Configuring a reference field
In the value settings screen, specify three items: the “reference layer”, the “matching field on the reference side”, and the “key field on your own layer’s side”. The Data edit screen lists reference data whose key matches. You can also add reference data from that list.
“Used to add data” for a dictionary field
Turn on “Used to add data” in the options of a “string-dictionary” or “string-dynamic dictionary” field. An input box then appears at the top of the Data list screen, letting you quickly add data just by choosing a candidate. Only one field per layer can use this option.
Setting values
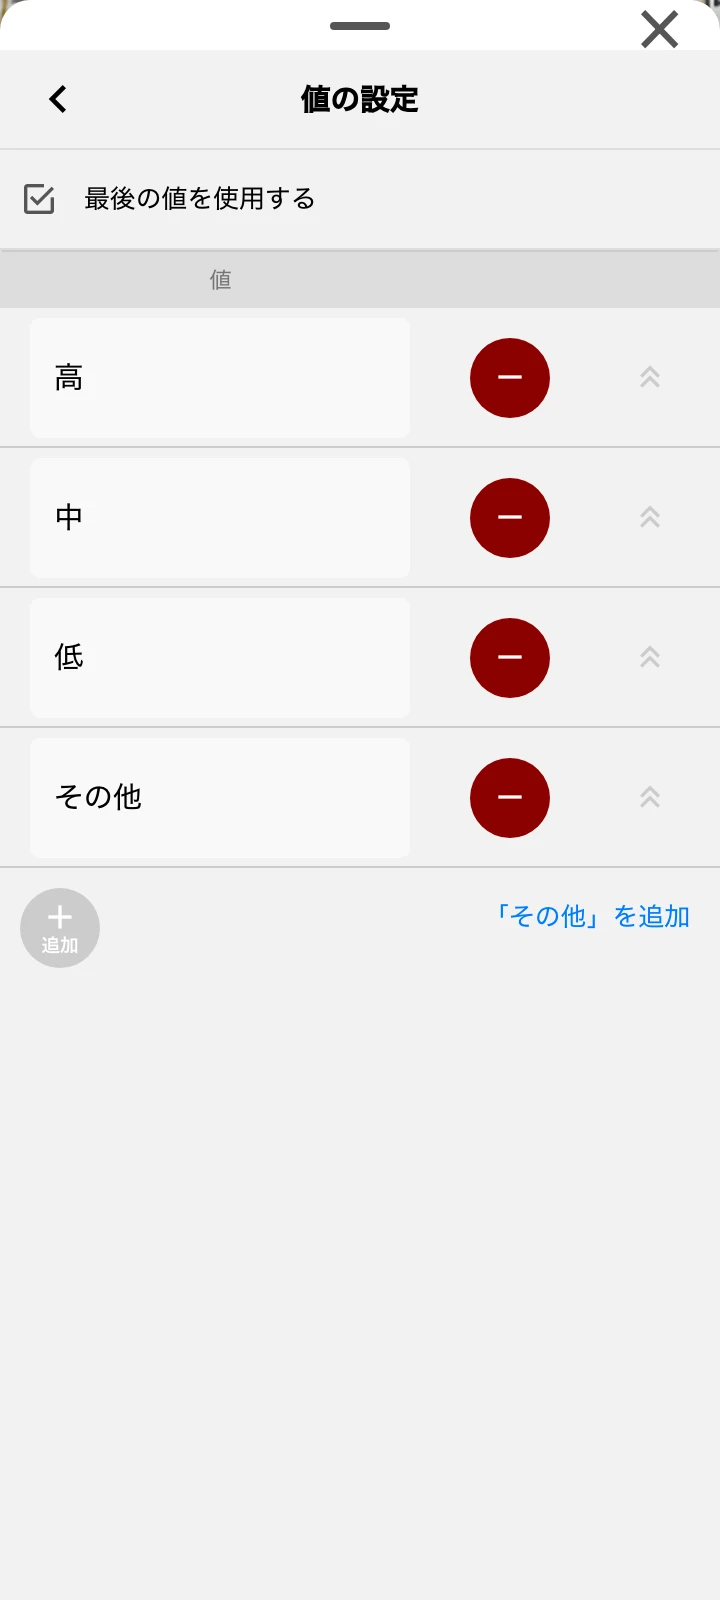
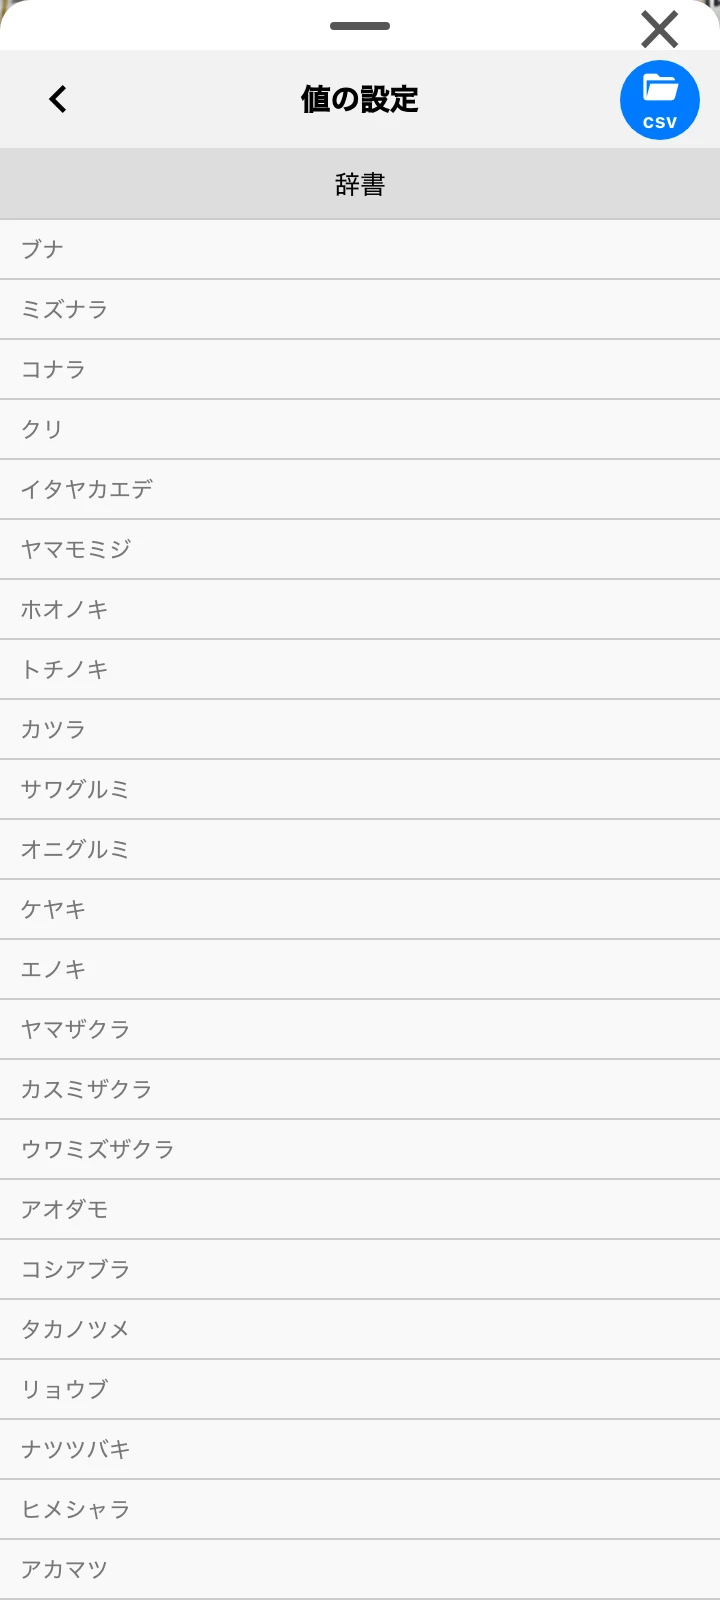
- Value — Enter a default value or candidate value. Use “add” to add more candidates, and you can also reorder and delete them.
- Code field (List / Radio) — When you want to record a symbol or number (code) alongside the text of a choice, select the field the code is written to. A code column then appears in the value list, where you enter the code for each choice. During data entry, choosing an option fills in the code automatically (the code field itself becomes read-only).
- Add “Other” — Adds a fixed candidate “Other” for List / Check / Radio. When you choose “Other” during data entry, a free input box appears.
- Use last value — A check shown for String, Integer, List, Date, and TimeRange. When on, the previous entry becomes the initial value for the next data.
- Loading a dictionary from CSV — For “string-dictionary”, the “csv” button to the right of the header batch-registers candidate values from a CSV file. Each row becomes a candidate, and reloading replaces them.