 EcorisMap
CHAPTER 10
Check Data
You can check recorded data from each layer’s data list, or by tapping a feature on the map. Tapping a layer name in the Layer list opens that layer’s Data list screen.
Data list
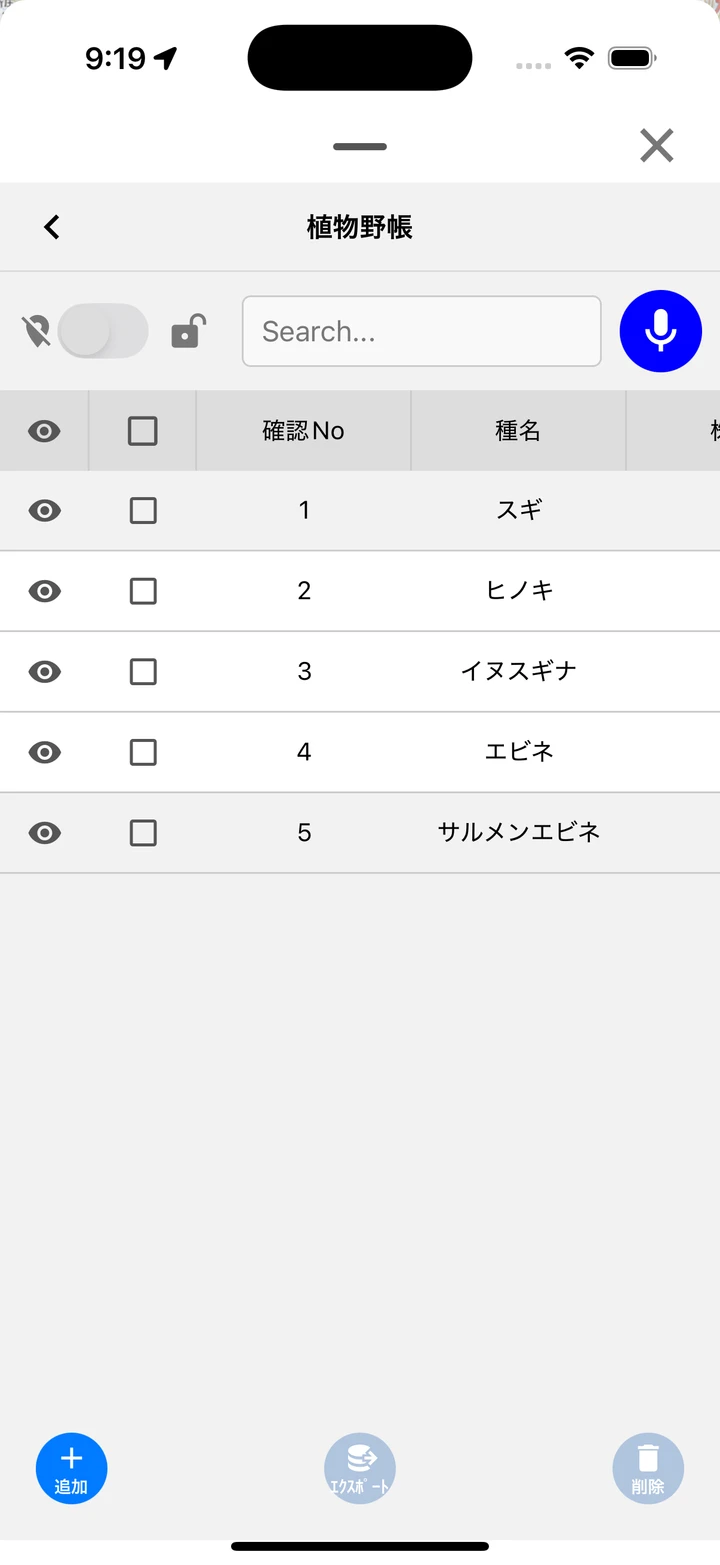
Table operations
- Visibility toggle (eye icon) — Shows or hides each item of data. Use the header icon to toggle all at once.
- Checkbox — Selects the data to export or delete. Use the header to select or deselect all.
- Sorting — Each tap on a field name cycles through descending → ascending → off. Sorting is not available for the photo column. You can also reorder manually by long-pressing and dragging a row.
- Filtering — Use the filter button at the top of the screen, or long-press a field name. See “Filtering data”.
- Row tap — Opens the Data edit screen.
- Row background — Data without a location is shown on a white background, so you can tell it apart from data that has one.
Buttons at the bottom
- add — Creates new data and opens the Data edit screen. See Record Data.
- export — Writes out the checked data. See Export Data.
- delete — Deletes the checked data, with a “Do you want to delete the data?” confirmation.
Note: The “Project common” layers of a project are read-only for members. The add and delete buttons are disabled.
Filtering data
Use this on a layer with a lot of data when you want to pull out only the data for a particular species or area.
- Tap the filter button at the top of the screen (to the right of the layer name). You can also long-press a field name in the table to open the filter for that column.
- Choose the target column, then type what you are looking for or tap a value in the candidate list, and press “OK”.
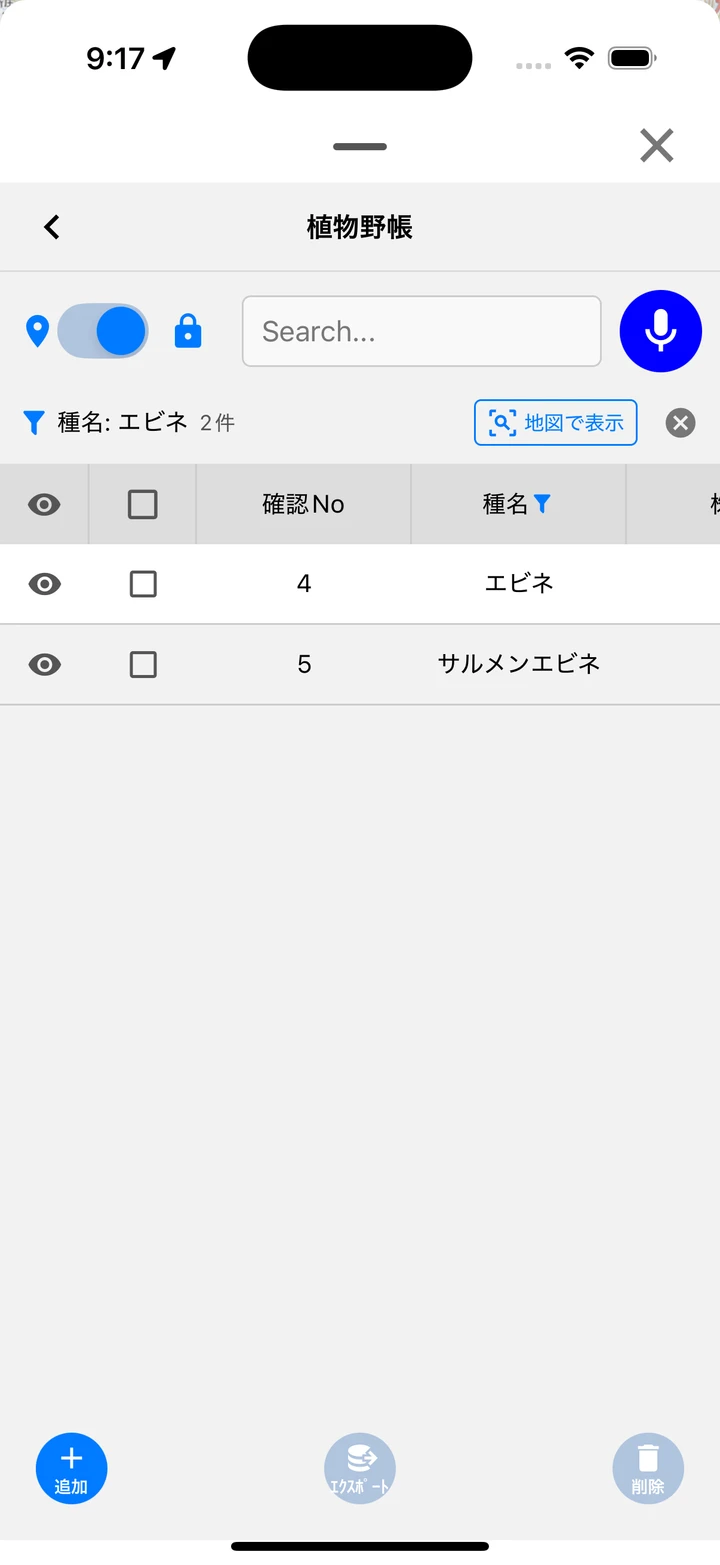
- Only the matching data is listed.
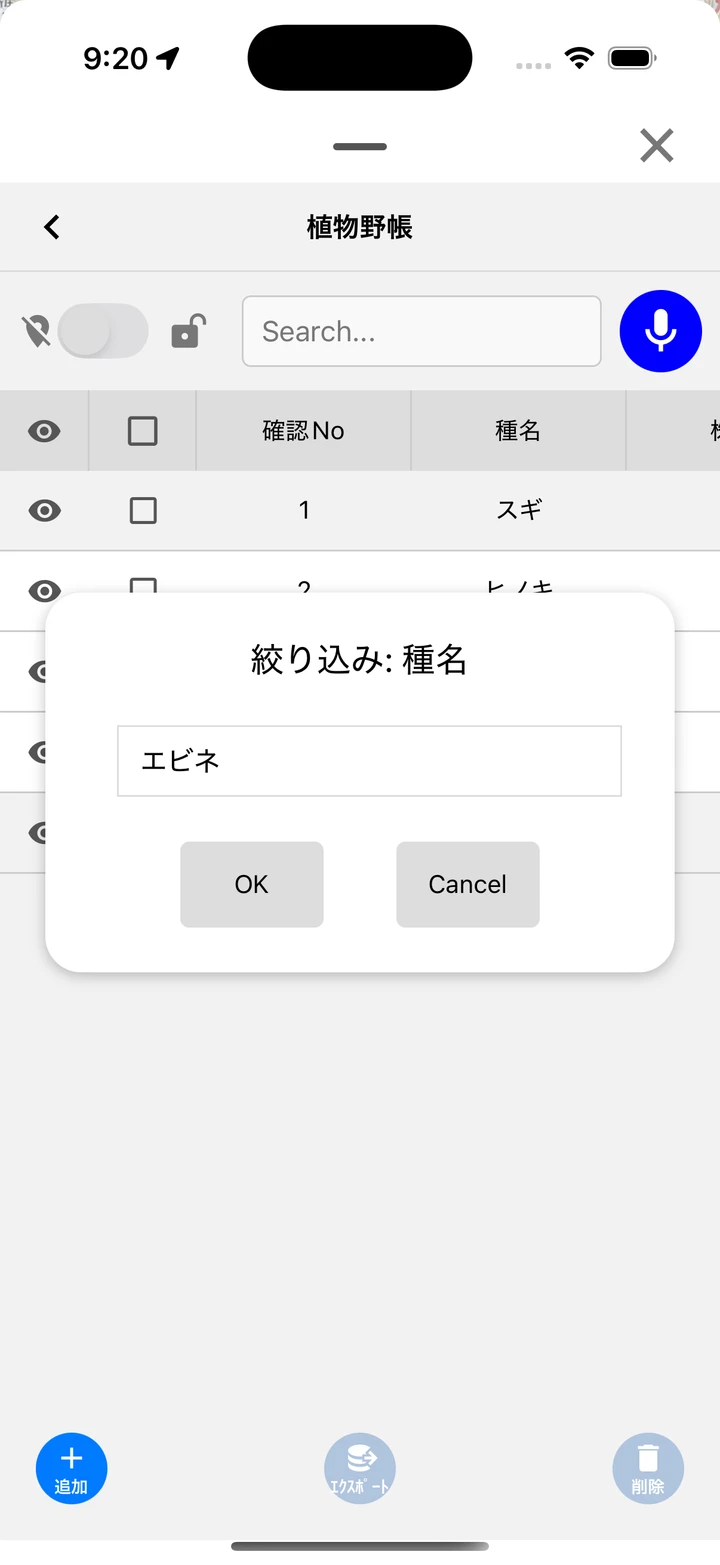 |  |
- Target column — Switch with the chips above the input box. When you are in a project, you can also pick User to filter by who recorded the data.
- Candidate list — Shows the values entered in the chosen column. Tapping one puts it in the input box, and typing narrows the candidates.
- (Blanks) / (Non blanks) — At the top of the candidate list; tapping one applies immediately. Useful for finding records whose value has not been entered yet and filling them in the field.
- Matching is by substring. The difference between katakana and hiragana is absorbed, so “すぎ” finds “スギ”.
- While a filter is active the filter button turns blue, and the field name of the target column gets a funnel icon.
- A filter bar appears above the table showing the condition and the number of records.
- Show on map — Shows only the filtered data on the map and moves to its extent. Clearing the filter restores the visibility as it was before you pressed the button.
- Clear (✕) — Clears the filter and shows all data. Emptying the input box and pressing “OK” also clears it.
Checking from the map
Tapping a feature (point, line, or polygon) on the map shows its attribute information as a sheet over the map. It is the same Data edit screen, so you can edit the values right there (see Record Data).
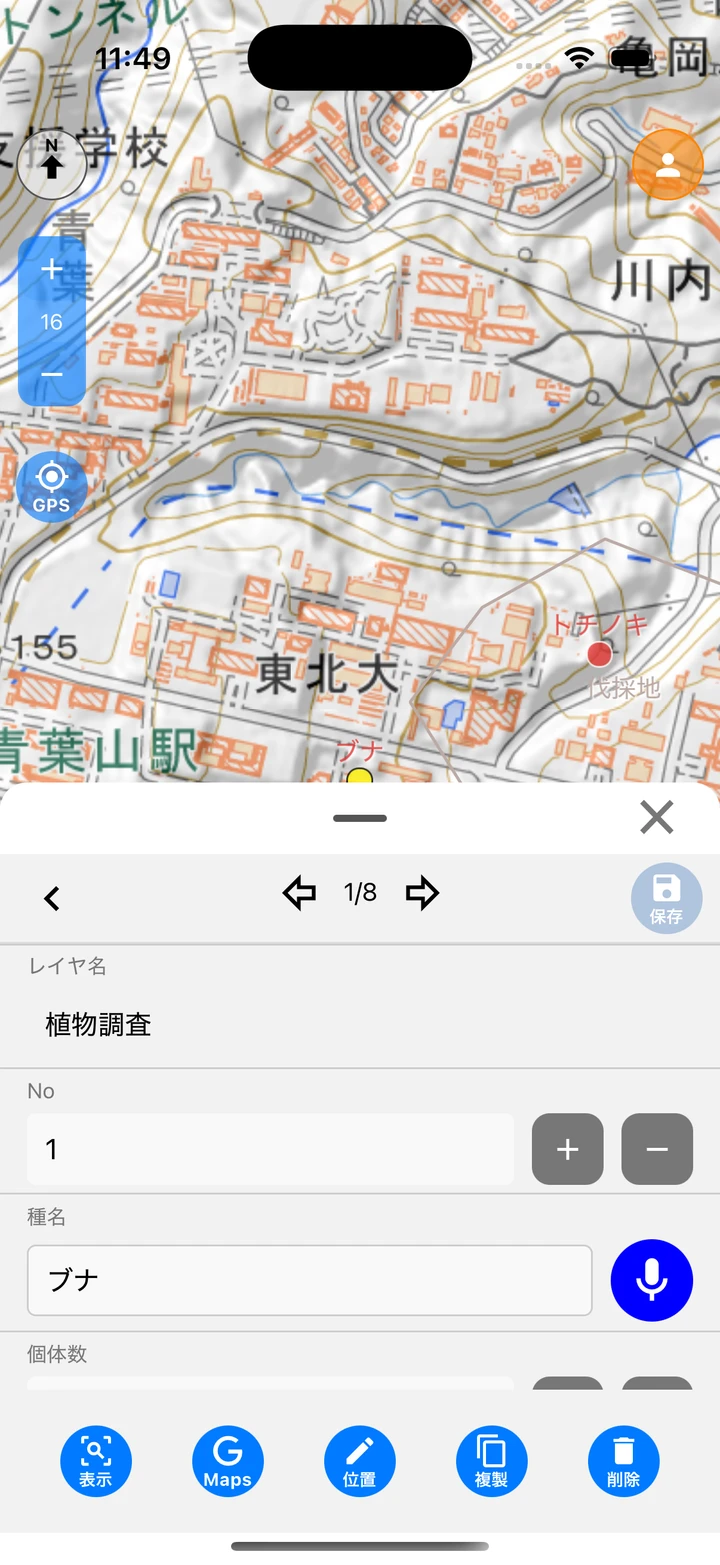
Note: While a draw tool is in use, tapping the map is treated as an editing operation. To view attributes, select “draw” in the draw menu to turn the tool off.
You can also go the other way, from the list to the map. Use the filter to find the data you want, tap the row, and press “jump” to move to that location on the map.
Heading to the site with Google Maps
When you travel to a survey site by car or on foot, it is handy to open the location in Google Maps and use its route guidance. You decide the place in EcorisMap and leave the navigation to Google Maps.
There are two ways to open it.
- Head to recorded data — On the Data edit screen, opened by tapping a row in the list (or a feature on the map), press Maps. Google Maps opens at that data’s location. For lines and polygons, it uses the first vertex.
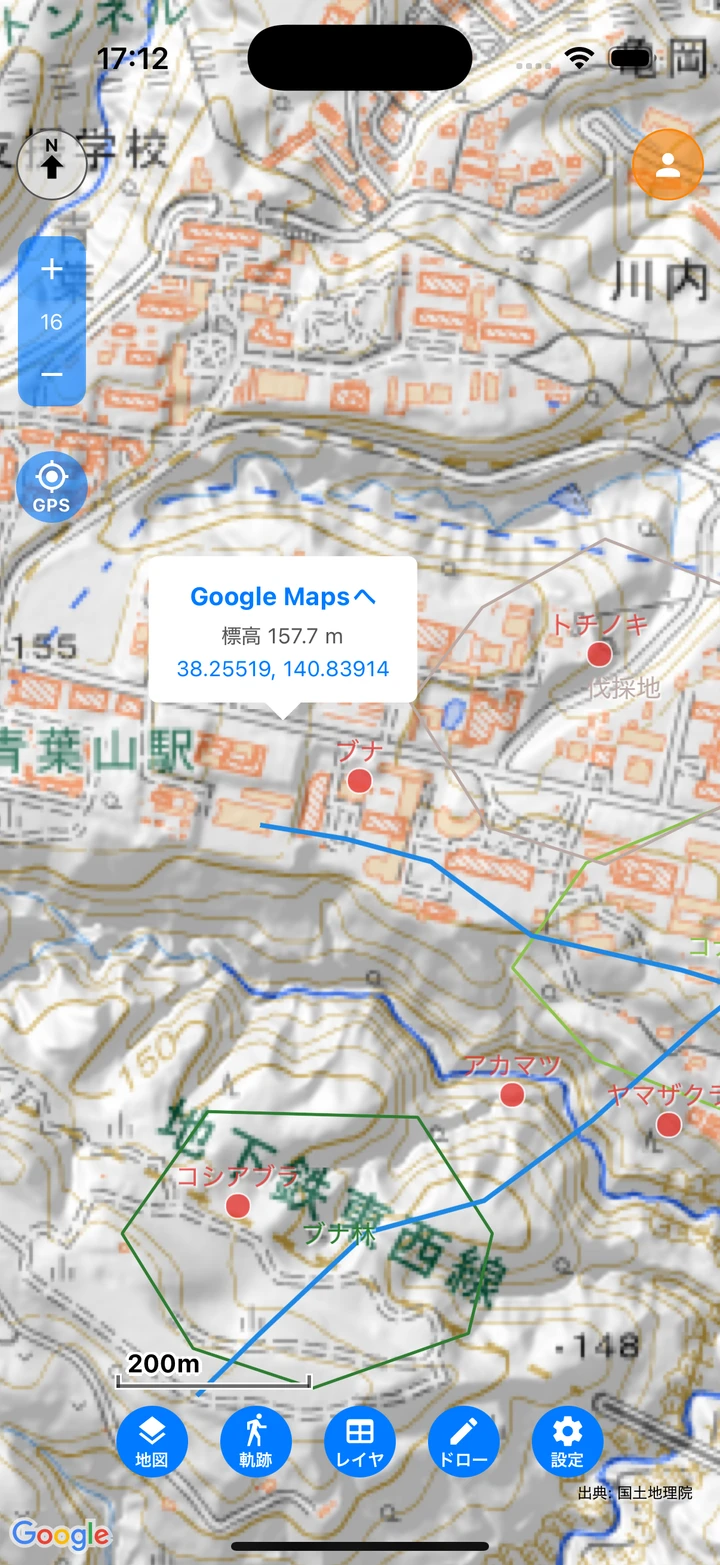
- Head to any place on the map — Long-press the map to show the popup, then tap “Google Maps” in it. A place you have not recorded yet, or a POI (place or facility name) on the Google map, can be your destination. See Reading the Home Screen.
Once Google Maps opens, tapping “Directions” starts navigation.
Note: On iOS the Google Maps app opens, falling back to the browser if it is not installed. On Android your default map app opens. If part of the route has no signal, downloading an offline map in Google Maps as well is a good idea.
Measuring a distance
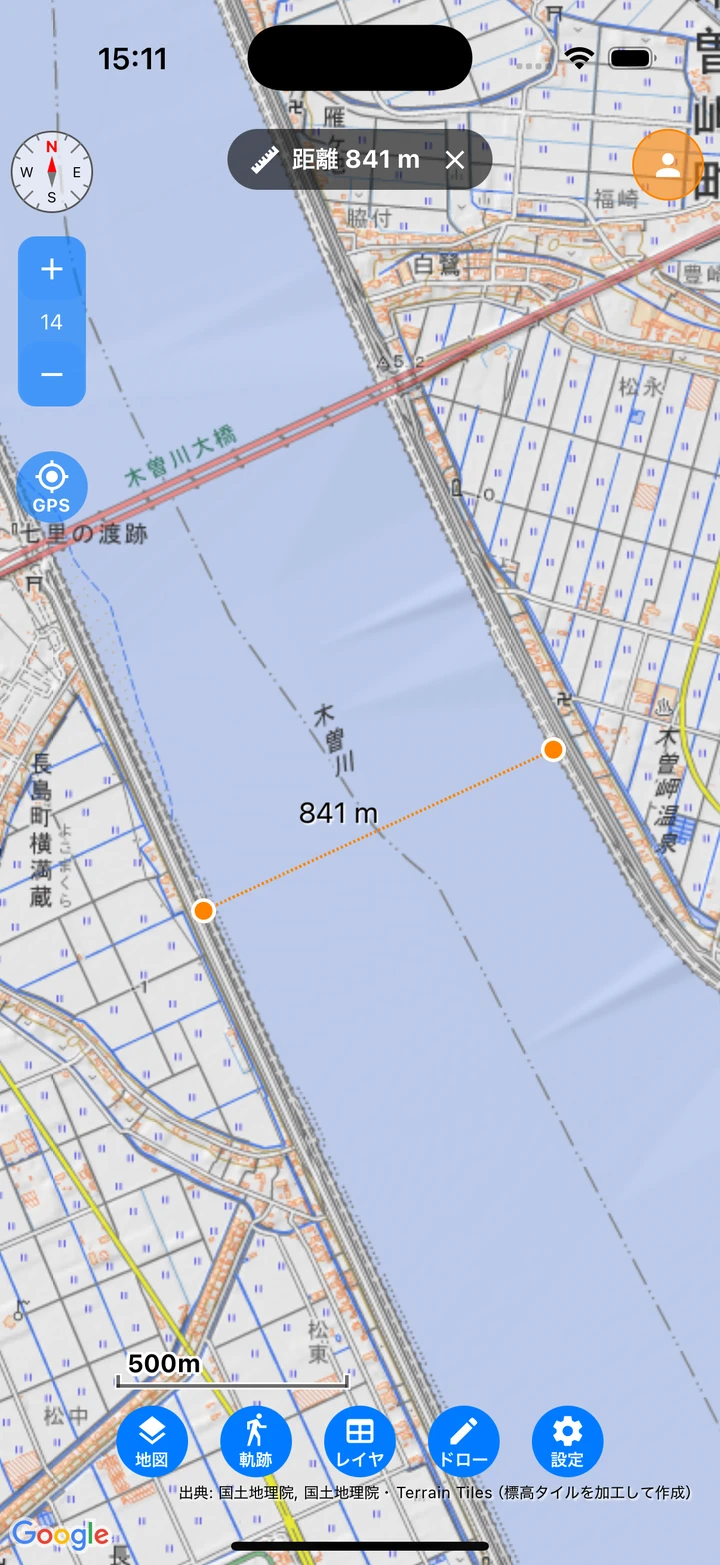
Tap “Measure Distance” in the popup shown by long-pressing the map to start measuring from that point. Tap the map to draw a dashed line to the tapped spot, with the distance shown on a label at the middle of the line and in a banner at the top of the screen. Tap somewhere else to measure again. You can still pan and zoom while measuring; end it with the banner’s ”×” or by starting a draw tool.
Showing labels
To tell features apart on the map, you can display a field value as a label. Choose the field in the Label column of the Layer list.
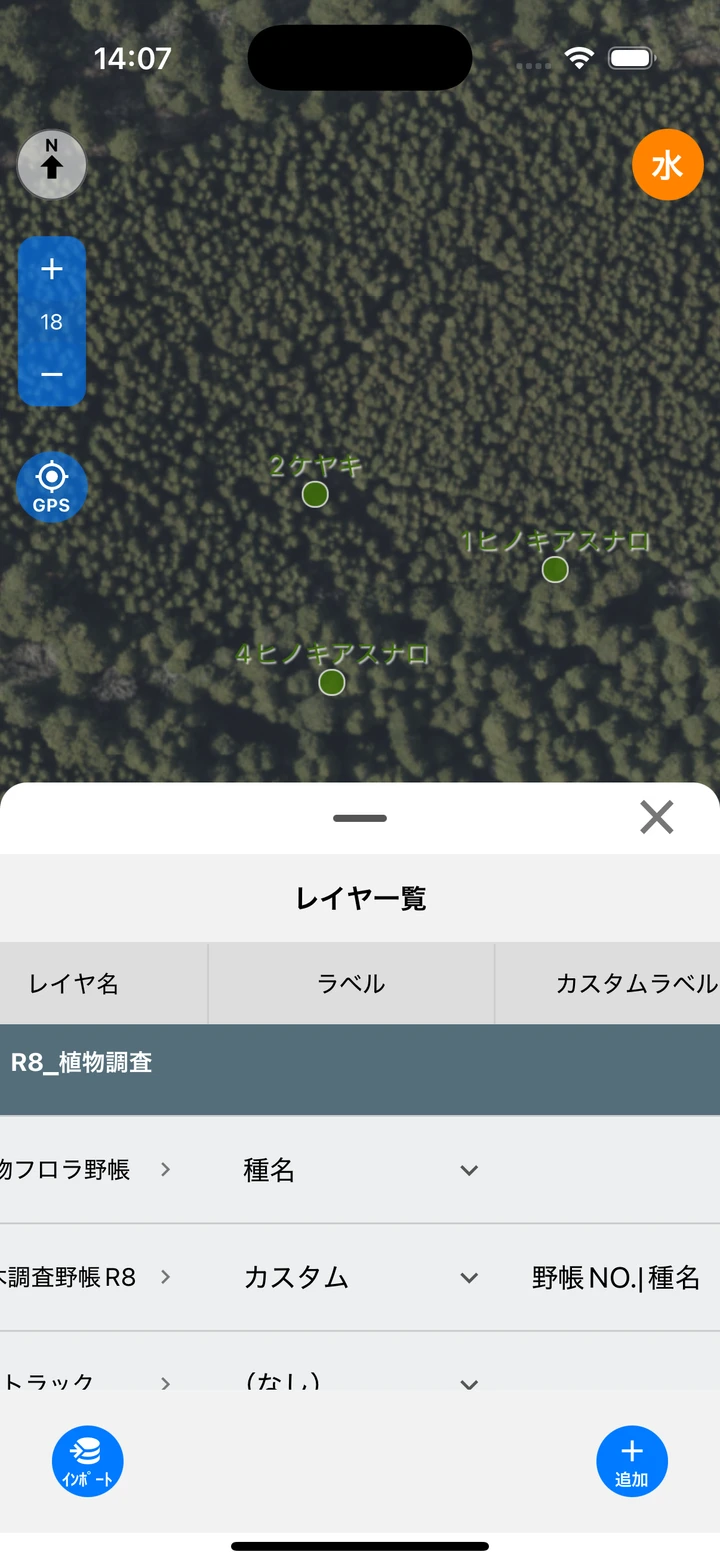
- Choosing “(none)” hides the label.
- Choosing “CUSTOM” reveals an input box next to it, where you can create a label combining multiple fields in the form
field1|field2. - Labels are not shown when the map is zoomed out to a wide area.
Changing the style
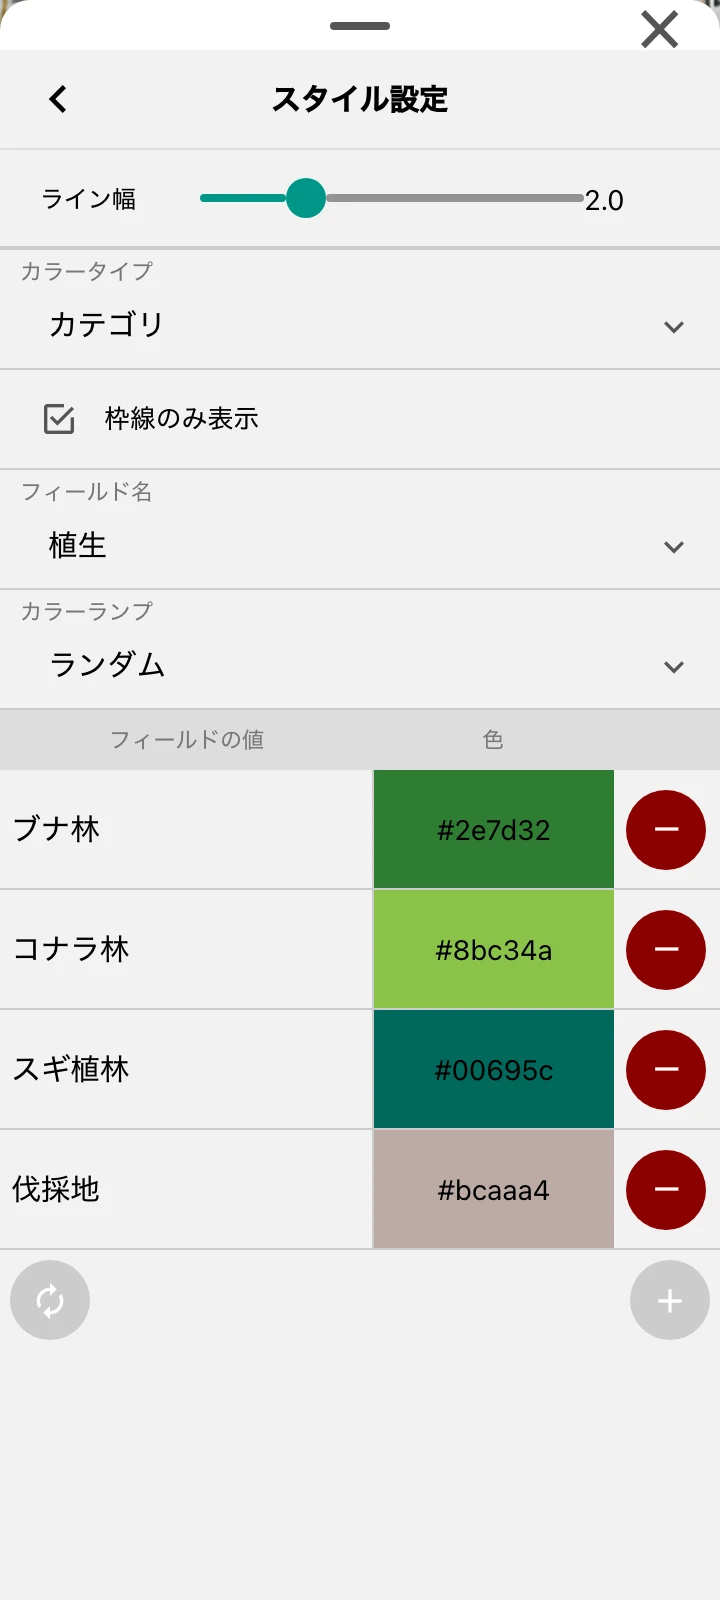
Coloring by value lets you read trends straight from the map. Tapping the color mark in the Layer list (points, lines, and polygons only), or the color mark on the Layer settings screen, opens the Style settings screen.
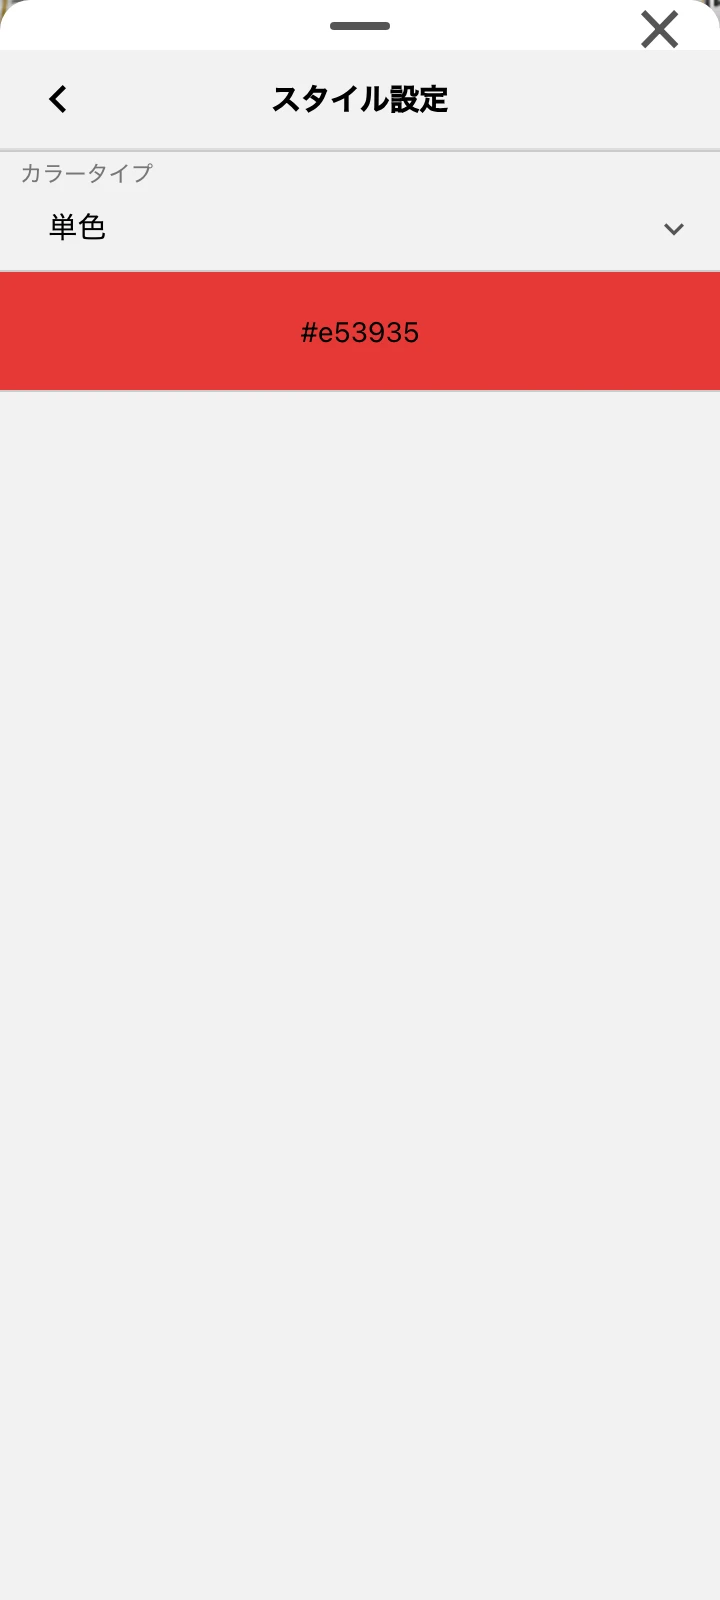
First choose a “Color type”. The settings shown below it change with the type you choose.
- Single — Displays the entire layer in one color. Tap the color swatch and choose hue, saturation, brightness, and transparency in the color picker.
- Categorized — Colors by each field value. You set which value gets which color.
- User — Colors by member. Its settings are the same as Categorized. It can be selected only while a project is open (see Project Features).
- Individual — Each drawn line or shape has its own color. It is used by the Memo layer and by line/polygon layers whose color type is Individual, keeping the color you chose when drawing (see Draw Points, Lines & Polygons). It cannot be selected for points. If you switch from Individual to another type, the colors follow the type you chose while the line widths stay as drawn.
The following settings are common to all types.
- Line width (1–5) — Specifies the width of lines and polygons. It is not shown for layers whose color type is “Individual” (features are drawn at the width they were drawn at).
- Show frame only — Removes the polygon fill and displays only the outline.
Settings for Categorized and User
Choosing Categorized or User shows the following settings.
- Field — Choose the field to color by. Choosing “CUSTOM” shows an input box, letting you classify by the combination
field1|field2. - Color ramp — The method for automatic coloring. Currently only Random is available.
- Auto-fetch — Collects the list of field values from existing data and automatically assigns colors. For User, it retrieves the member list.
- Value and color list — Add and delete values here. Tap each color to change it individually.